Sustainability Target
The Asset Manager considers efforts such as energy conservation and reducing greenhouse gas emissions in relation to asset management to be serious environmental issues. As such, it establishes individual policies and strives to reduce the burden it puts on the environment.
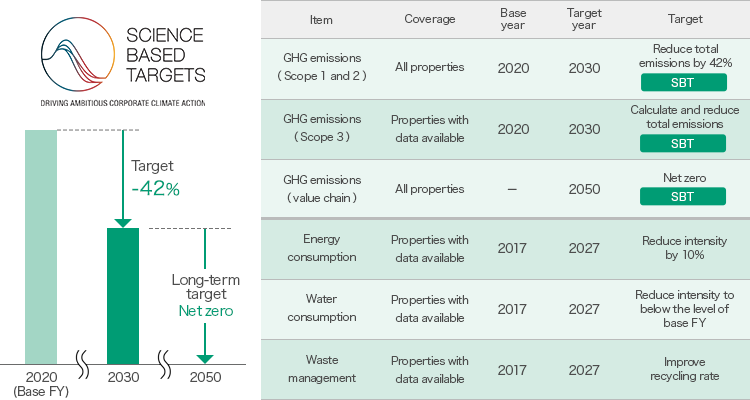
Furthermore, we have established the following reduction target (medium to long term) for energy consumption.
Long-term Environmental Vision of “Challenge ZERO 2055”
Looking ahead to 2055, which marks the 100th anniversary of the foundation of Daiwa House Industry Co., Ltd. (hereinafter referred to as “Daiwa House”), the Daiwa House Group formulated a long-term environmental vision of “Challenge ZERO 2055” in fiscal year ended March 2017. The Daiwa House Group aims to realize a sustainable society in accord with its Group Management Vision of being a Group that co-creates value for individuals, communities and lifestyles. It will challenge to reduce its environmental impact to zero with respect to four environmental priority themes (mitigation of and adaptation to climate change, harmony with the natural environment, conservation of water and other natural resources, and prevention of chemical pollution) through the three stages of procurement, business activities, and products/services.

Establishment of EMS (Environmental Management System) Operation Manual
In managing DHR’s properties, the Asset Manager continuously endeavors to reduce environmental burden by setting environmental targets related to energy consumption, GHG emissions, water consumption and waste, obtaining results, analyzing the results against targets and implementing corrective measures and improvements through a PDCA (plan-do-check-act) cycle in accord with an EMS Operation Manual that provides detailed instructions on implementing policies on objectives such as saving energy, reducing GHG emissions, conserving water and managing waste.
In operating the environmental management system, the Asset Manager complies with applicable environmental laws and regulations and other environmental requirements.
Commitments Related to Greenfield Developments
The Daiwa House Group is involved in a wide range of development throughout Japan, which has a high impact on the natural environment. In development business, the Daiwa House Group is thorough in its efforts to assess the impact of development projects on the natural environment of the site beforehand and is committed to minimizing the loss before commercializing the business.
Violations of Environmental Laws and Regulations and Environmental Accidents
There were not any significant violations of environmental laws and regulations or significant environmental accidents at DHR’s properties that would affect stakeholders. There were also no environment-related fines or penalties. (Fiscal year ended March 2023)
Environmental Performance
Energy Consumption
| FY ended Mar. 2018 (base year) |
FY ended Mar. 2020 | FY ended Mar. 2021 | FY ended Mar. 2022 | FY ended Mar. 2023 | |
|---|---|---|---|---|---|
| Number of properties | 143 properties | 190 properties | 201 properties | 211 properties | 215 properties |
| Total amount (MWh) | 76,440 | 190,299 | 209,212 | 256,078 | 280,399 |
| Consumption intensity (MWh/m2) | 0.1253 | 0.0929 | 0.0858 | 0.089 | 0.0912 |
| Reduction rate of intensity | - | -24.7% | -31.5% | -29.0% | -27.2% |
| Coverage | 28.4% | 67.0% | 76.3% | 80.0% | 85.3% |
- Aggregation period
The aggregation period is from every April to the following March. Results are updated annually in principle. - Calculation method
Calculated using only DHR’s properties for which the requisite data are available.
Consumption intensity is calculated by dividing total electricity usage and CO₂ emissions by intensity denominator (gross floor area (㎡)) - Except for certain ones, these figures are verified/assured by a third party based on International Standard on Assurance Engagements (ISAE) 3000 “Assurance Engagements Other than Audits or Reviews of Historical Financial Information.”
- Environmental Performance Data Independent Verification ReportPDF
GHG Emissions
| FY ended Mar. 2018 (base year) |
FY ended Mar. 2020 | FY ended Mar. 2021 | FY ended Mar. 2022 | FY ended Mar. 2023 | |
|---|---|---|---|---|---|
| Number of properties | 143 properties | 190 properties | 201 properties | 211 properties | 215 properties |
| Scope 1 | 34,336 | 197 | 115 | 198 | 195 |
| Scope 2 (location-based) | 6,465 | 6,597 | 6,648 | 6,586 | |
| Scope 3 (only from fuel/electricity consumption associated with tenant-managed assets) |
78,147 | 89,924 | 98,951 | 104,290 | |
| Scope 1+Scope 2 (location-based) + Scope 3 | 34,336 | 84,808 | 96,636 | 105,798 | 111,072 |
| Scope 1+Scope 2 (location-based) + Scope 3 Emission intensity (t-CO2/m2) |
0.0556 | 0.0420 | 0.0397 | 0.0368 | 0.0361 |
| Reduction rate of intensity | - | -24.5% | -28.6% | -33.8% | -35.1% |
- Aggregation period
The aggregation period is from every April to the following March. Results are updated annually in principle. - Calculation method
Calculated using only DHR’s properties for which the requisite data are available.
Emission intensity is calculated by dividing total electricity usage and CO2 emissions by intensity denominator (gross floor area (㎥)). - Except for certain ones, these figures are verified/assured by a third party based on International Standard on Assurance Engagements (ISAE) 3410 “Assurance Engagements on Greenhouse Gas Statements.”
- Greenhouse Gas Emissions Independent Verification Report (Limited Assurance)PDF
Water Consumption
| FY ended Mar. 2018 (base year) |
FY ended Mar. 2020 | FY ended Mar. 2021 | FY ended Mar. 2022 | FY ended Mar. 2023 | |
|---|---|---|---|---|---|
| Number of properties | 142 properties | 190 properties | 200 properties | 211 properties | 215 properties |
| Total amount (㎥) | 391,637 | 900,955 | 852,793 | 927,080 | 1,011,485 |
| Consumption intensity (㎥/㎡) | 0.8205 | 0.4296 | 0.3503 | 0.3307 | 0.3352 |
| Reduction rate of intensity | - | -47.6% | -57.3% | -59.7% | -59.1% |
| Coverage | 22.2% | 69.6% | 76.2% | 77.9% | 83.8% |
- Aggregation period
The aggregation period is from every April to the following March. Results are updated annually in principle. - Calculation method
Calculated using only DHR’s properties for which the requisite data are available. - Except for certain ones, these figures are verified/assured by a third party based on International Standard on Assurance Engagements (ISAE) 3000 “Assurance Engagements Other than Audits or Reviews of Historical Financial Information.”
- Environmental Performance Data Independent Verification ReportPDF
Waste Management (Recycling Rate)
| FY ended Mar. 2018 (base year) |
FY ended Mar. 2020 | FY ended Mar. 2021 | FY ended Mar. 2022 | FY ended Mar. 2023 | |
|---|---|---|---|---|---|
| Number of properties | 6 properties | 41 properties | 55 properties | 66 properties | 75 properties |
| Total amount (t) | 1,202 | 12,990 | 14,445 | 20,910 | 23,115 |
| Recycling rate | 54.2% | 77.0% | 79.7% | 78.7% | 71.9% |
| Coverage | 6.9% | 43.5% | 55.0% | 56.4% | 65.1% |
- Aggregation period
The aggregation period is from every April to the following March. Results are updated annually in principle. - Calculation method
Calculated using only DHR’s properties for which the requisite data are available. - Except for certain ones, these figures are verified/assured by a third party based on International Standard on Assurance Engagements (ISAE) 3000 “Assurance Engagements Other than Audits or Reviews of Historical Financial Information.”
- Environmental Performance Data Independent Verification ReportPDF