Creation and Utilization of a Heatmap of Dependencies and Impacts on Nature
DHR has developed a heatmap using ENCORE (Exploring Natural Capital Opportunities, Risks and Exposure) (Note 1) and the SBTN Materiality Screening Tool (Note 2) developed by UNEP (United Nations Environment Programme) and has organized the degree of nature-related dependencies and impacts in real estate management (direct operations) and construction (upstream) into five levels.
Using the organized results and following the LEAP (Locate, Evaluate, Assess, Prepare) approach, we have identified and analyzed nature-related dependencies and impacts on DHR’s operations, as well as identified and evaluated nature-related risks and opportunities.
- ENCORE: https://encore.naturalcapital.finance/en
- SBTN Materiality Screening Tool: https://sciencebasedtargetsnetwork.org/wp-content/uploads/2023/05/SBTN-Materiality-Screening-Tool-v1.xlsx
Heatmap of Dependencies
Confirmed a high dependency on surface water in real estate management (direct operations).

Heatmap of Impacts
Confirmed a very high impact on “Terrestrial ecosystem use” and high impacts on “Solid waste” and “GHG emissions” in real estate management (direct operations)

Methodology for Analyzing Nature-related Dependencies and Impacts
Analyzing Nature-related Dependencies and Impacts
The aforementioned heatmap was used as a reference to analyze the nature-related dependencies and impacts of the top 100 properties (80.1% coverage) based on acquisition price as high-priority properties for DHR.
Methodology for Analyzing Nature-related Dependencies
| Evaluation item | Evaluation method | |
|---|---|---|
| Ecological status of the property area | (1) Ecological integrity (Note 1) | |
| (2) Ecological importance (Note 2) | ||
| (3) Water stress (Note 3) | ||
| Dependency status | Energy | Amount used (Note 4) |
| Water | Amount used (Note 5) | |
| Resources | Land area of the property is scored and evaluated (Note 6) | |
| Overall evaluation (dependency) |
Energy | Amount used (Note 4) |
| Water | Water use and water stress are scored and evaluated | |
| Resources | Land area of the property is scored and evaluated (Note 6) | |
Methodology for Analyzing Nature-related Impacts
| Evaluation item | Evaluation method | |
|---|---|---|
| Impact status | Waste | Amount of waste (Note 7) |
| GHG | GHG emissions (Note 8) | |
| State of ecosystem services/crisis | Ecological integrity and importance are scored and evaluated | |
| Overall evaluation (impact) | Waste | Ecological integrity, importance, and amount of waste are scored and evaluated |
| GHG | Ecological integrity, importance, and GHG emissions are scored and evaluated | |
- Evaluated using the WWF Risk Filter Suite, which assesses the state of ecosystems.
https://riskfilter.org/biodiversity/explore/map - The area surrounding the property (within a 1 km radius) was evaluated based on (1) Whether or not it is designated as a nature conservation area, (2) The number of plant species listed in the Red Data Book, (3) The number of bird species listed in the Red Data Book, and (4) The number of useful plant species.
https://biodiversity-map.thinknature-japan.com/ - Evaluated using the WRI Aqueduct indicator, which assesses the amount of water resources.
https://www.wri.org/applications/aqueduct/water-risk-atlas/#/?advanced=false&basemap=hydro&indicator=w_awr_def_tot_cat&lat=-14.445396942837744&lng=-142.85354599620152&mapMode=view&month=1&opacity=0.5&ponderation=DEF&predefined=false&projection=absolute&scenario=optimistic&scope=baseline&timeScale=annual&year=baseline&zoom=2 - Evaluated based on annual electricity consumption.
- Evaluated based on annual water consumption.
- Evaluated based on land area.
- Evaluated based on annual amount of waste, assuming that the waste is disposed of in the vicinity.
- Evaluated based on annual GHG emissions assuming Scope 1.
Results of Nature-related Dependencies and Impacts Analysis
Results of Nature-related Dependency Analysis
The results of the analysis confirmed a high score (high dependency) for resources.
The results of the analysis of the top ten properties based on acquisition price and the top 100 properties based on acquisition price (80.1% coverage) in terms of nature-related dependencies are as follows.
(As of January 31, 2024)
| Asset class | Property number | Property name | Acquisition price (millions of yen) |
Location | Dependency | ||||||||
|---|---|---|---|---|---|---|---|---|---|---|---|---|---|
| Ecological status of the property area | Dependency status | Overall evaluation (dependency) | |||||||||||
| Energy | Water | Resources | Energy | Water | Resources | ||||||||
| Ecological integrity | Ecological importance | Water stress | Amount used | Amount used | Scored evaluation | Amount used | Scored evaluation | Scored evaluation | |||||
| Retail | RM-012 | iias Tsukuba | 34,120 | Tsukuba City, Ibaraki | ★★★ | ★ | ★★ | ★★★ | ★★★ | ★★★ | ★★★ | ★★★ | ★★★ |
| Logistics | LM-004 | DPL Nagareyama I | 32,600 | Nagareyama City, Chiba | ★★★ | ★★ | ★★ | ★★★ | ★ | ★★★ | ★★★ | ★★ | ★★★ |
| Logistics | LM-006 | DPL Nagareyama III | 32,000 | Nagareyama City, Chiba | ★★★ | ★★ | ★★ | Unevaluated | Unevaluated | ★★★ | Unevaluated | ★ | ★★★ |
| Other | OT-006 | GRANODE Hiroshima | 28,800 | Hiroshima City, Hiroshima | ★★ | ★★★ | ★★ | ★★ | ★★ | ★★★ | ★★ | ★★★ | ★★★ |
| Logistics | LB-006 | D Project Urayasu II | 26,000 | Urayasu City, Chiba | ★★★ | ★★ | ★★ | ★ | ★ | ★★★ | ★ | ★★ | ★★★ |
| Logistics | LM-001 | DPL Misato | 16,831 | Misato City, Saitama | ★★★ | ★ | ★★ | ★★ | ★ | ★★★ | ★★ | ★★ | ★★★ |
| Logistics | LB-002 | D Project Hachioji | 15,400 | Hachioji City, Tokyo | ★★★ | ★★ | ★★ | ★★★ | ★ | ★★★ | ★★★ | ★★ | ★★★ |
| Logistics | LB-066 | D Project Hiratsuka | 15,200 | Hiratsuka City, Kanagawa | ★★★ | ★★ | ★★ | ★ | ★ | ★★★ | ★ | ★ | ★★★ |
| Logistics | LM-002 | DPL Fukuoka Kasuya | 13,300 | Kasuya District, Fukuoka | ★★ | ★★ | ★★ | ★ | ★ | ★★★ | ★ | ★ | ★★★ |
| Logistics | LB-060 | D Project Itabashi Shingashi | 12,300 | Itabashi Ward, Tokyo | ★★★ | ★ | ★★ | ★★ | ★ | ★★★ | ★★ | ★★ | ★★★ |
| Average score of 100 properties (Note) | 2.8 | 1.8 | 2.0 | 1.6 | 1.3 | 2.6 | 1.6 | 1.8 | 2.6 | ||||
- The average scores are calculated via weighting by acquisition price. (Lowest ★ 1.0 to Highest ★ ★ ★ 3.0)
Results of Nature-related Impact Analysis
The results of the analysis confirmed a high score (high impact) for GHG.
The results of the analysis of the top ten properties based on acquisition price and the top 100 properties based on acquisition price (80.1% coverage) in terms of nature-related impacts are as follows.
(As of January 31, 2024)
| Asset class | Property number | Property name | Acquisition price (millions of yen) |
Location | Impact | ||||
|---|---|---|---|---|---|---|---|---|---|
| Impact status | State of ecosystem services/crisis | Overall evaluation (impact) | |||||||
| Waste | GHG | Waste | GHG | ||||||
| Amount of waste | Emissions | Scored evaluation | Scored evaluation | Scored evaluation | |||||
| Retail | RM-012 | iias Tsukuba | 34,120 | Tsukuba City, Ibaraki | ★★★ | ★★★ | ★★ | ★★★ | ★★★ |
| Logistics | LM-004 | DPL Nagareyama I | 32,600 | Nagareyama City, Chiba | ★ | ★★★ | ★★★ | ★★ | ★★★ |
| Logistics | LM-006 | DPL Nagareyama III | 32,000 | Nagareyama City, Chiba | Unevaluated | Unevaluated | ★★★ | ★ | ★ |
| Other | OT-006 | GRANODE Hiroshima | 28,800 | Hiroshima City, Hiroshima | ★ | ★★ | ★★★ | ★★ | ★★★ |
| Logistics | LB-006 | D Project Urayasu II | 26,000 | Urayasu City, Chiba | ★ | ★★ | ★★★ | ★★ | ★★★ |
| Logistics | LM-001 | DPL Misato | 16,831 | Misato City, Saitama | ★ | ★★ | ★★ | ★★ | ★★★ |
| Logistics | LB-002 | D Project Hachioji | 15,400 | Hachioji City, Tokyo | ★ | ★★★ | ★★★ | ★★ | ★★★ |
| Logistics | LB-066 | D Project Hiratsuka | 15,200 | Hiratsuka City, Kanagawa | ★ | ★ | ★★★ | ★★ | ★★ |
| Logistics | LM-002 | DPL Fukuoka Kasuya | 13,300 | Kasuya District, Fukuoka | ★ | ★ | ★★ | ★ | ★ |
| Logistics | LB-060 | D Project Itabashi Shingashi | 12,300 | Itabashi Ward, Tokyo | ★★★ | ★★ | ★★ | ★★★ | ★★★ |
| Average score of 100 properties (Note) | 1.3 | 1.8 | 1.6 | 1.9 | 2.2 | ||||
- The average scores are calculated via weighting by acquisition price. (Lowest ★ 1.0 to Highest ★ ★ ★ 3.0)
Process of Nature-related Scenario Analysis
Based on the analysis of the LEAP approach, scenario analysis is conducted to evaluate the impact on DHR’s business under different scenarios and to assess strategic resilience to nature-related risks and opportunities.
Scenario Analysis Process
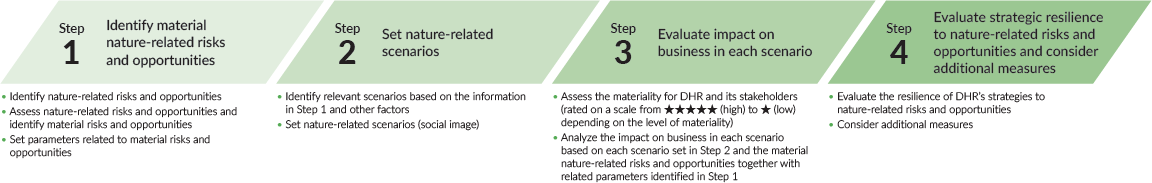
Step 1: Identify material nature-related risks and opportunities
- Identify nature-related risks and opportunities
- Assess nature-related risks and opportunities and identify material risks and opportunities
- Set parameters related to material risks and opportunities
| Classification | Type | Anticipated timeframe | Description of risks and opportunities | |
|---|---|---|---|---|
| Risk | Physical | Acute | Short to long term | Increased repair costs of buildings and exteriors due to extreme weather conditions, as well as the degradation and cessation of natural ecosystem functions, etc., caused by increased GHG emissions |
| Decreased rent income due to increased natural disasters such as typhoons and floods caused by heavy rains | ||||
| Increased non-life insurance premiums due to increased natural disasters such as typhoons and floods caused by heavy rains | ||||
| Transition | Market | Medium to long term | Business risks, risks of exclusion from the supply chain, and risks of lower earnings if unable to respond to the rising biodiversity needs of customers (e.g., obtaining biodiversity-related environmental certifications (JHEP, ABINC, etc.)) | |
| Reputation | Medium to long term | Declined investment unit prices and increased funding costs due to delays in biodiversity response | ||
| Opportunity | Market | Medium to long term | Increased business opportunities, avoiding exclusion from the supply chain, and increased earnings opportunities when responding to the rising biodiversity needs of customers (e.g., obtaining biodiversity-related environmental certifications (JHEP, ABINC, etc.)) | |
| Funding | Medium to long term | Increased investment unit prices and decreased funding costs due to biodiversity response | ||
| Resilience | Long term | Enhanced resilience and reduction of future cost incurrence risks and business risks by enhanced response to biodiversity | ||
Step 2: Set nature-related scenarios
- Identify relevant scenarios based on the information in Step 1 and other factors
- Set nature-related scenarios (social image)
Overview of anticipated scenarios
| Scenario A | |
|---|---|
| Transition risk | High |
| Physical risk | Low |
A scenario in which efforts in policy, institutional, and financial aspects of biodiversity conservation are strengthened and promoted, while nature destruction and loss of ecosystem services are curbed.
Transition risk is higher than in Scenario B, but physical risk is lower.
| Scenario B | |
|---|---|
| Transition risk | Low |
| Physical risk | High |
A scenario in which efforts in policy, institutional, and financial aspects of biodiversity conservation fail to make progress, resulting in the further destruction of nature and the loss of ecosystem services.
Transition risk is lower than in Scenario A, but physical risk is higher.
Step 3-1: Evaluate impact on business in Scenario A and Scenario B
- Assess the materiality for DHR and its stakeholders (rated on a scale from ★ (high) to ★ (low) depending on the level of materiality)
Description of risks/opportunities and materiality assessment
| Classification | Type | No. | Description of risks and opportunities | Materiality assessment (Note) | |
|---|---|---|---|---|---|
| Risk | Physical | Acute | (1) | Increased repair costs of buildings and exteriors due to extreme weather conditions, as well as degradation and cessation of natural ecosystem functions, etc. | ★★★★★ |
| (2) | Decreased rent income due to increased natural disasters | ★★★ | |||
| (3) | Increased non-life insurance premiums due to increased natural disasters | ★★★ | |||
| Transition | Market | (4) | Business risks, risks of exclusion from the supply chain, and risks of lower earnings if unable to respond to the rising biodiversity needs of customers (e.g., obtaining biodiversity-related environmental certifications (JHEP, ABINC, etc.)) | ★ | |
| Reputation | (5) | Declined investment unit prices and increased funding costs due to delays in biodiversity response | ★★★★ | ||
| Opportunity | Market | (6) | Increased business opportunities, avoiding exclusion from the supply chain, and increased earnings opportunities when responding to the rising biodiversity needs of customers (e.g., obtaining biodiversity-related environmental certifications (JHEP, ABINC, etc.)) | ★★ | |
| Funding | (7) | Increased investment unit prices and decreased funding costs due to biodiversity response | ★★★★ | ||
| Resilience | (8) | Enhanced resilience and reduction of future cost incurrence risks and business risks by enhanced response to biodiversity | ★★★★ | ||

Step 3-2: Evaluate impact on business in Scenario A and Scenario B
- Analyze the impact on business in each scenario based on each scenario set in Step 2 and the material nature-related risks and opportunities together with related parameters identified in Step 1
Step 4: Evaluate strategic resilience to nature-related risks and opportunities and consider additional measures
- Evaluate the resilience of DHR’s strategies to nature-related risks and opportunities
- Consider additional measures
Impact on Business and Countermeasures
| Classification | Type | Description of risks and opportunities | Business impact | Countermeasures | ||
|---|---|---|---|---|---|---|
| Scenario A | Scenario B | |||||
| Risk | Physical | Acute | Increased repair costs of buildings and exteriors due to extreme weather conditions, as well as degradation and cessation of natural ecosystem functions, etc. | Large | Large |
|
| Decreased rent income due to increased natural disasters | Large | Large | ||||
| Increased non-life insurance premiums due to increased natural disasters | Medium | Medium | ||||
| Transition | Market | Business risks, exclusion from the supply chain, and risks of lower earnings if unable to respond to the rising biodiversity needs of customers (e.g., obtaining biodiversity-related environmental certifications (JHEP, ABINC, etc.)) | Large | Large |
|
|
| Reputation | Declined investment unit prices and increased funding costs due to delays in biodiversity response | Medium | Medium | |||
| Opportunities | Market | Increased business opportunities, avoiding exclusion from the supply chain, and increased earnings opportunities when responding to the rising biodiversity needs of customers (e.g., obtaining biodiversity-related environmental certifications (JHEP, ABINC, etc.)) | Large | Large | ||
| Funding | Increased investment unit prices and decreased funding costs due to biodiversity response | Medium | Medium | |||
| Resilience | Enhanced resilience and reduction of future cost incurrence risks and business risks by enhanced response to biodiversity | Large | Large |
|
||