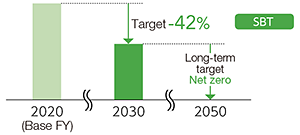
GHG Emissions and Energy-related Targets
DHR set targets of reducing total GHG emissions by 42% in the fiscal year ending March 2031 compared to the fiscal year ended March 2021 and achieving net zero emissions by the fiscal year ending March 2051, and became the first J-REIT to obtain SBTi certification for its SBT 1.5℃ targets.

| Item | Coverage | Base year | Target year | Target |
|---|---|---|---|---|
|
GHG emissions (Scope 1 and 2) |
All properties | 2020 | 2030 |
Reduce total emissions by 42%
SBT |
| 2050 |
Net zero
SBT |
|||
|
GHG emissions (Scope 3) |
Properties with data available | 2020 | 2030 |
Calculate and reduce total emissions
SBT |
| 2050 |
Net zero
SBT |
|||
| Energy consumption | Properties with data available | 2017 | 2027 | Reduce consumption intensity by 10% |
| Water consumption | Properties with data available | 2017 | 2027 | Reduce intensity to below the level of base FY |
| Waste management | Properties with data available | 2017 | 2027 | Improve recycling rate |
GHG Emissions of Portfolio Properties (Scope 1, 2, and 3)
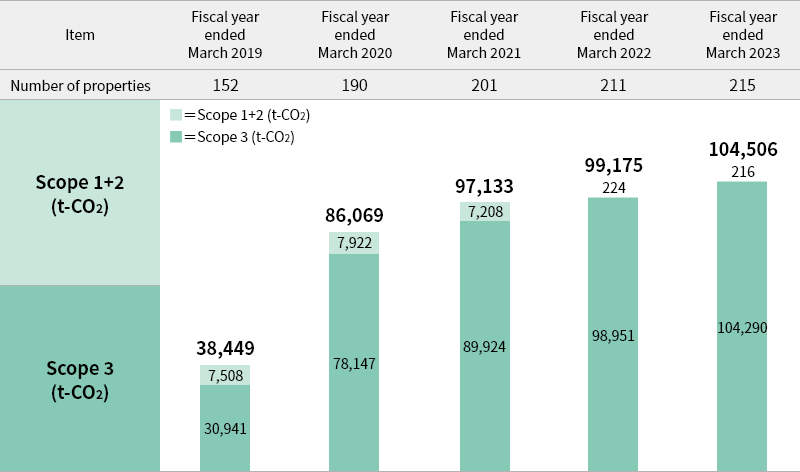
* Market-based
Unit: t-CO2
| Asset class | Fiscal year ended March 2021 (Base year) |
Fiscal year ended March 2022 |
Fiscal year ended March 2023 |
Fiscal year ended March 2024 |
Fiscal year ended March 2025 |
|---|---|---|---|---|---|
| Logistics | 51,706 | 60,880 | 67,756 | 75,288 | 73,772 |
| Residential | 6,595 | 4,513 | 18,973 | 18,783 | 16,093 |
| Retail | 30,450 | 28,219 | 27,808 | 28,119 | 27,187 |
| Hotel | 1,823 | 2,155 | 2,532 | 3,139 | 3,373 |
| Other | 6,559 | 3,444 | 666 | 1,067 | 1,070 |
| Total | 97,133 | 99,210 | 117,736 | 126,396 | 121,494 |
- The above table represents GHG emissions data collected from tenants in the properties owned by DHR.
- The Scope 3 data shown represents GHG emissions from tenant energy use (category 13).
- The main factors leading to an increase in emissions are an increase in the acquisition of new properties and an increase in the scope of data acquisition.
GHG Emissions by Category (Scope 3)
Boundary: DHR, owned properties
Unit: t-CO2
| Category | Fiscal year ended March 2021 (Base year) |
Fiscal year ended March 2022 | Fiscal year ended March 2023 | Fiscal year ended March 2024 | Fiscal year ended March 2025 | |
|---|---|---|---|---|---|---|
| Upstream | 1. Purchased goods and services | 160 | 45 | 8,609 | 13,232 | 17,942 |
| 2. Capital goods | 18,310 | 29,694 | 8,443 | 13,115 | 13,560 | |
| 3. Fuel- and energy-related activities not included in Scope 1 or Scope 2 | 1,067 | 1,124 | 1,095 | 1,137 | 1,162 | |
| 4. Upstream Transportation and Distribution | 3 | 2 | 2 | 2 | 2 | |
| 5. Waste generated in operations | 130 | 164 | 156 | 194 | 159 | |
| 6. Business travel | 0 | 0 | 0 | 0 | 0 | |
| 7. Employee commuting | 0 | 0 | 0 | 0 | 0 | |
| Downstream | 13. Downstream leased assets | 95,263 | 106,690 | 127,008 | 137,940 | 133,801 |
- Calculated based on “Guidelines for Accounting of Greenhouse Gas Emissions of Organizations through the Supply Chain” by the Ministry of the Environment. Categories not listed above have no emission sources or are included in Scope 1 and Scope 2.
- Category 13 covers GHG emissions from tenant energy use and waste disposal.
-
Figures are verified by a third party based on “ISO 14064-3:2019 Greenhouse gases - Part 3: Specification with guidance for the verification and validation of greenhouse gas statements.”
Greenhouse Gas Emissions Independent Verification Report (Limited Assurance)PDF - The main reason for the increase in category 1 from the fiscal year ended March 2024 onward is that emissions from the outsourced management services of portfolio properties have been included in the calculation scope.
Response to climate change for portfolio properties
In response to the rising risk of flood damage due to climate change, DHR has taken the following measures to improve property resilience to such risks.
Considered Measures
- We checked the relevant area hazard maps for all portfolio properties.
- For properties at risk of flooding, we verified elevation, first-floor height, and local gradients to assess the risk.
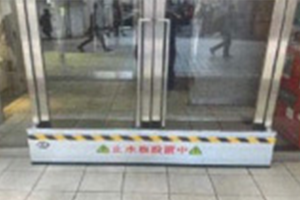
- For properties where human risk and the impact on electrical and mechanical rooms, as well as underground parking, were considered significant, we evaluated the installation of sandbags and water stop plates for each property to prepare for potential damage.
Implemented Measures
- We installed sandbags and water stop plates on properties deemed to be significantly vulnerable to human risks and flood-related physical risks, and reviewed on-site operations during disasters.
- We conducted disaster prevention training, confirmation of communication systems during disasters, and re-confirmation of awareness regarding hazard maps, evacuation centers, etc.
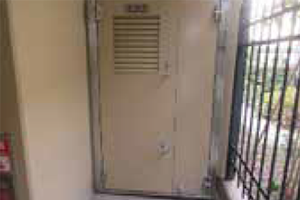
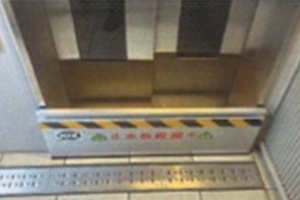
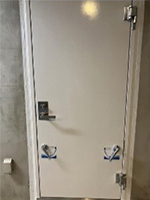
- For Royal Parks SEASIR (residential facility), we installed waterproof panels and waterproof doors at the entrance, electrical room, elevators, and management office to reduce the impact of water damage from torrential rains and large-scale typhoons.
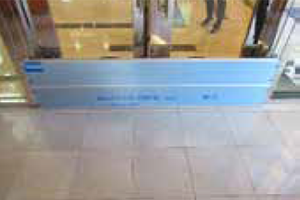
- We installed water stop plates at entrances, in front of elevators, at basement entryways, etc., to reduce the impact of water damage from torrential rains and large-scale typhoons.
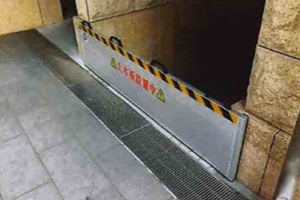
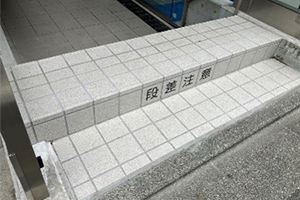
- We implemented measures such as raising the entrance level, installing waterproof doors, adding overflow pipes to rainwater storage tanks, and increasing the number of drainage outlets.
- DHR continuously monitors disaster risks and enhances property resilience by addressing both physical measures (preventive measures that can be physically implemented) and soft measures (such as awareness of hazard maps and evacuation centers, and establishing communication systems).
- We will take risk reduction measures and reduce the percentage of properties owned that are exposed to acute and chronic physical risks.
Physical Risk (Risk of Flooding)
- We address the risk by implementing countermeasures and maintaining fire insurance to cover potential economic damage.
| Flood depth | Number of properties | Acquisition price (millions of yen) | Ratio (based on acquisition price) | High |
|---|---|---|---|---|
| Over 20m | 0 | 0 | 0.0% | Risk of flooding |
| 10m to 20m | 0 | 0 | 0.0% | |
| 5m to 10m | 7 | 112,436 | 12.3% | |
| 3m to 5m | 31 | 81,534 | 8.9% | |
| 0.5m to 3m | 98 | 376,506 | 41.1% | |
| 0.5m or less | 18 | 82,560 | 9.0% | |
| 0m | 77 | 262,397 | 28.7% | |
| Total | 231 | 915,433 | 100.0% | Low |
- Compiled by the Asset Manager in March 2026, based on the flood hazard map (estimated maximum size) (Source: Ministry of Land, Infrastructure, Transport and Tourism).
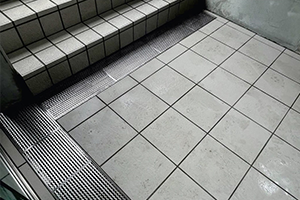
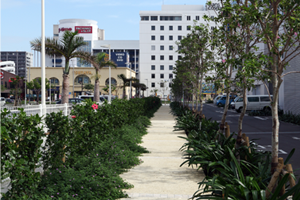
Prevention of Inland Flooding
We are working to prevent flooding by promoting the infiltration of rainwater into the ground through measures such as permeable interlocking pavement, underground infiltration basins, and the installation of rain gardens.
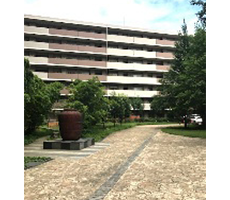
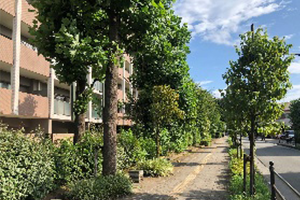
Greening and Countermeasures Against Heat Island Effect
Out of consideration for climate change, we carry out efforts such as those below at our properties.

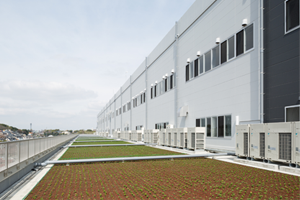
water-permeable paving
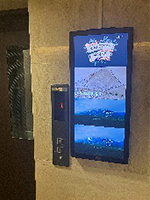
Installation of Signage Usable as Communication Boards During Disasters
In residential properties, we are advancing the installation of digital signage that can display pre-evacuation calls to residents and contact information for property management companies.
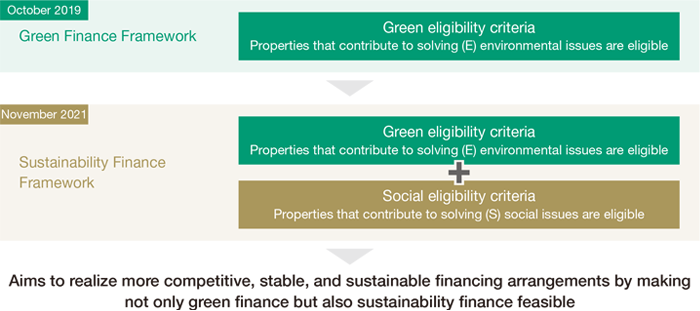
Establishment of Sustainability Finance Framework
- DHR will further promote sustainability activities by using Sustainability Finance as a means of financing with the aim of expanding an investor base with an interest in sustainability investment and securing a stable means of financing.
- In October 2019, DHR formulated a Green Finance Framework for implementing green finance. In November 2021, DHR formulated a Sustainability Finance Framework for implementing sustainability finance. While advancing such initiatives in Sustainability Finance, DHR will steadily proceed with executing financing through Sustainability Finance.
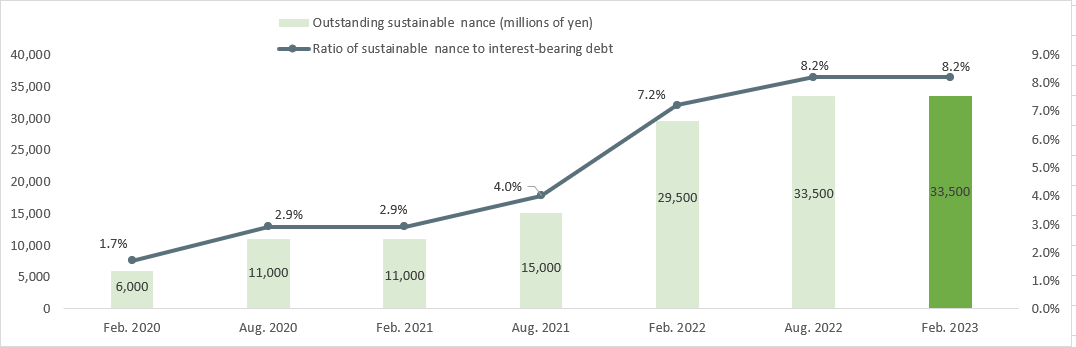
Execution of Sustainability Finance
- DHR has executed Sustainability Finance of ¥58,900 million (as of fiscal period ended February 28, 2026) under the above framework.
- The ratio of Sustainability Finance to interest-bearing debt has also increased through the continuous execution of Sustainability Finance.
Trends in Balance and Ratio of Sustainability Finance
Climate-related Opportunities
Targets for Obtaining Environmental Certifications of Portfolio Properties
- We are promoting the acquisition of third-party external certifications and evaluations to increase the objectivity and reliability of our sustainability initiatives at portfolio properties and improve the asset value over the medium to long term.
- Our policy is to increase the percentage of properties with environmental certification (based on gross floor area) to 75% or more by the fiscal year ending March 2031.
Status of Environmental Certification of Portfolio Properties
- The ratio of properties with environmental certification has improved to 73.7% (based on gross floor area).
(As of March 31, 2026)
For details, please refer to Green Building Certification “Obtainment of Green Building Certifications”
Concept and Definition of ZEB
Please refer to “ZEB and ZEH Certification” in Obtainment of Green Building Certifications
Capital Deployment (Purchase of Non-fossil Certificates and Investment in Solar Power Generation Equipment)
- We will reduce GHG emissions (Scope 2) by procuring FIT non-fossil certificates, etc. by participating in auctions in the renewable energy trading market.
- Reduce GHG emissions by proceeding with the switch to renewable energy-derived electricity options.
- We will reduce GHG emissions by investing in solar power generation equipment and switching existing equipment to own use.
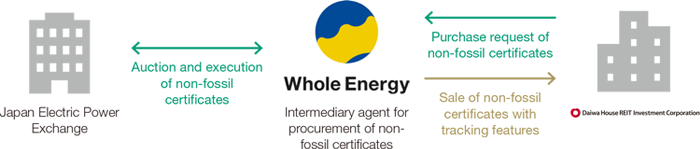
Purchase of Non-fossil Certificates
DHR participated in the renewable energy value trading market, which allows consumers and intermediaries to purchase FIT non-fossil certificates, and in the fiscal year ended March 2025 procured 25.0 million kWh FIT non-fossil certificates through an intermediary (hereinafter referred to as the “Procurement”).
Expected reduction effect of CO2 emissions by the Procurement was approx. 11,887 tons (t-CO2 equivalent), and all of the DHR’s electricity-derived GHG emissions (Scope 2) for the fiscal year ended March 2025 were offset.
Mechanism for procuring FIT non-fossil certificates by auction in the renewable energy value trading market
Internal Carbon Pricing
Revising the Internal Carbon Price
- The internal carbon price is set at ¥20,000 / t-CO2 and used to provide incentives for low-carbon promotion works, as guidelines for investment decision-making, and as a reference index to help identify risks related to future cost increases.
Utilizing the Internal Carbon Price
(1) Incentives for low-carbon promotion works
If GHG emissions are expected to be reduced by LED lighting and air conditioning renewal, we apply the internal carbon price and use the data as a reference to decide whether to perform construction work.
(2) Guidelines for investment decision making
After calculating the profit and loss by applying the internal carbon price to the GHG emissions of the target property, we use the data as a reference for investment decisions (when emissions can be calculated).
(3) Identification of Risks Related to Future Cost Increase
Calculate conversion amount by applying the internal carbon price to the GHG emissions corresponding to energy procurement, and select the low-emission suppliers with the aim of limiting the risk of increased procurement cost when a carbon tax is introduced in the future.
Example
- The investment decision on installation of solar power generation equipment at DPL Nagareyama III borne by DHR was made by balancing the cost and the revenue from power generation with the reduced GHG emissions multiplied by the internal carbon price.
- Make investment decisions based on the income and expense based on the reduction in GHG emissions from the introduction of renewable energy-derived electricity options for electricity contracts of retail facilities and others, where DHR bears the cost of electricity charges, multiplied by internal carbon price.
Sustainability Index-linked Fees
In November 2021, DHR introduced a provision to fluctuate the amount of asset management fees to the Asset Manager in conjunction with the sustainability indices as the first initiative in J-REITs for the purpose of increasing unitholder value by encouraging the reduction of GHG emissions of DHR properties and enhancing the external evaluations of its sustainability initiatives.
This is to increase or decrease the amount of asset management fees based on the sum of indexed GHG emissions reduction ratio, GRESB Rating, and CDP Score multiplied by the total assets of DHR, and is aimed at strengthening the commitment to solving sustainability issues and improving governance.
Asset Management Fee Structure
For details, please refer to Corporate Governance “Compensation of the Asset Manager.”
Remuneration for Executive Director of DHR
Remuneration for the Executive Officers of DHR incorporates sustainability index-linked fees, with remuneration tied to factors such as the GHG emissions reduction ratio, GRESB Rating, and CDP Score.
Compensation of Directors of the Asset Manager
For the compensation of directors at the Asset Manager, we have adopted a performance-based compensation structure that incorporates multiple evaluation criteria, including the DHR GRESB Rating, CDP Score, and whether any environmental law violations have occurred. The evaluation also includes the score from the eNPS survey of the Asset Manager’s officers and employees.